
Case Study
Revolutionized critical asset monitoring
Revolutionized asset monitoring in cold chain logistics and smart agriculture using Klyff's Edge AI-powered IoT platform for efficiency, sustainability, and real-time insights.
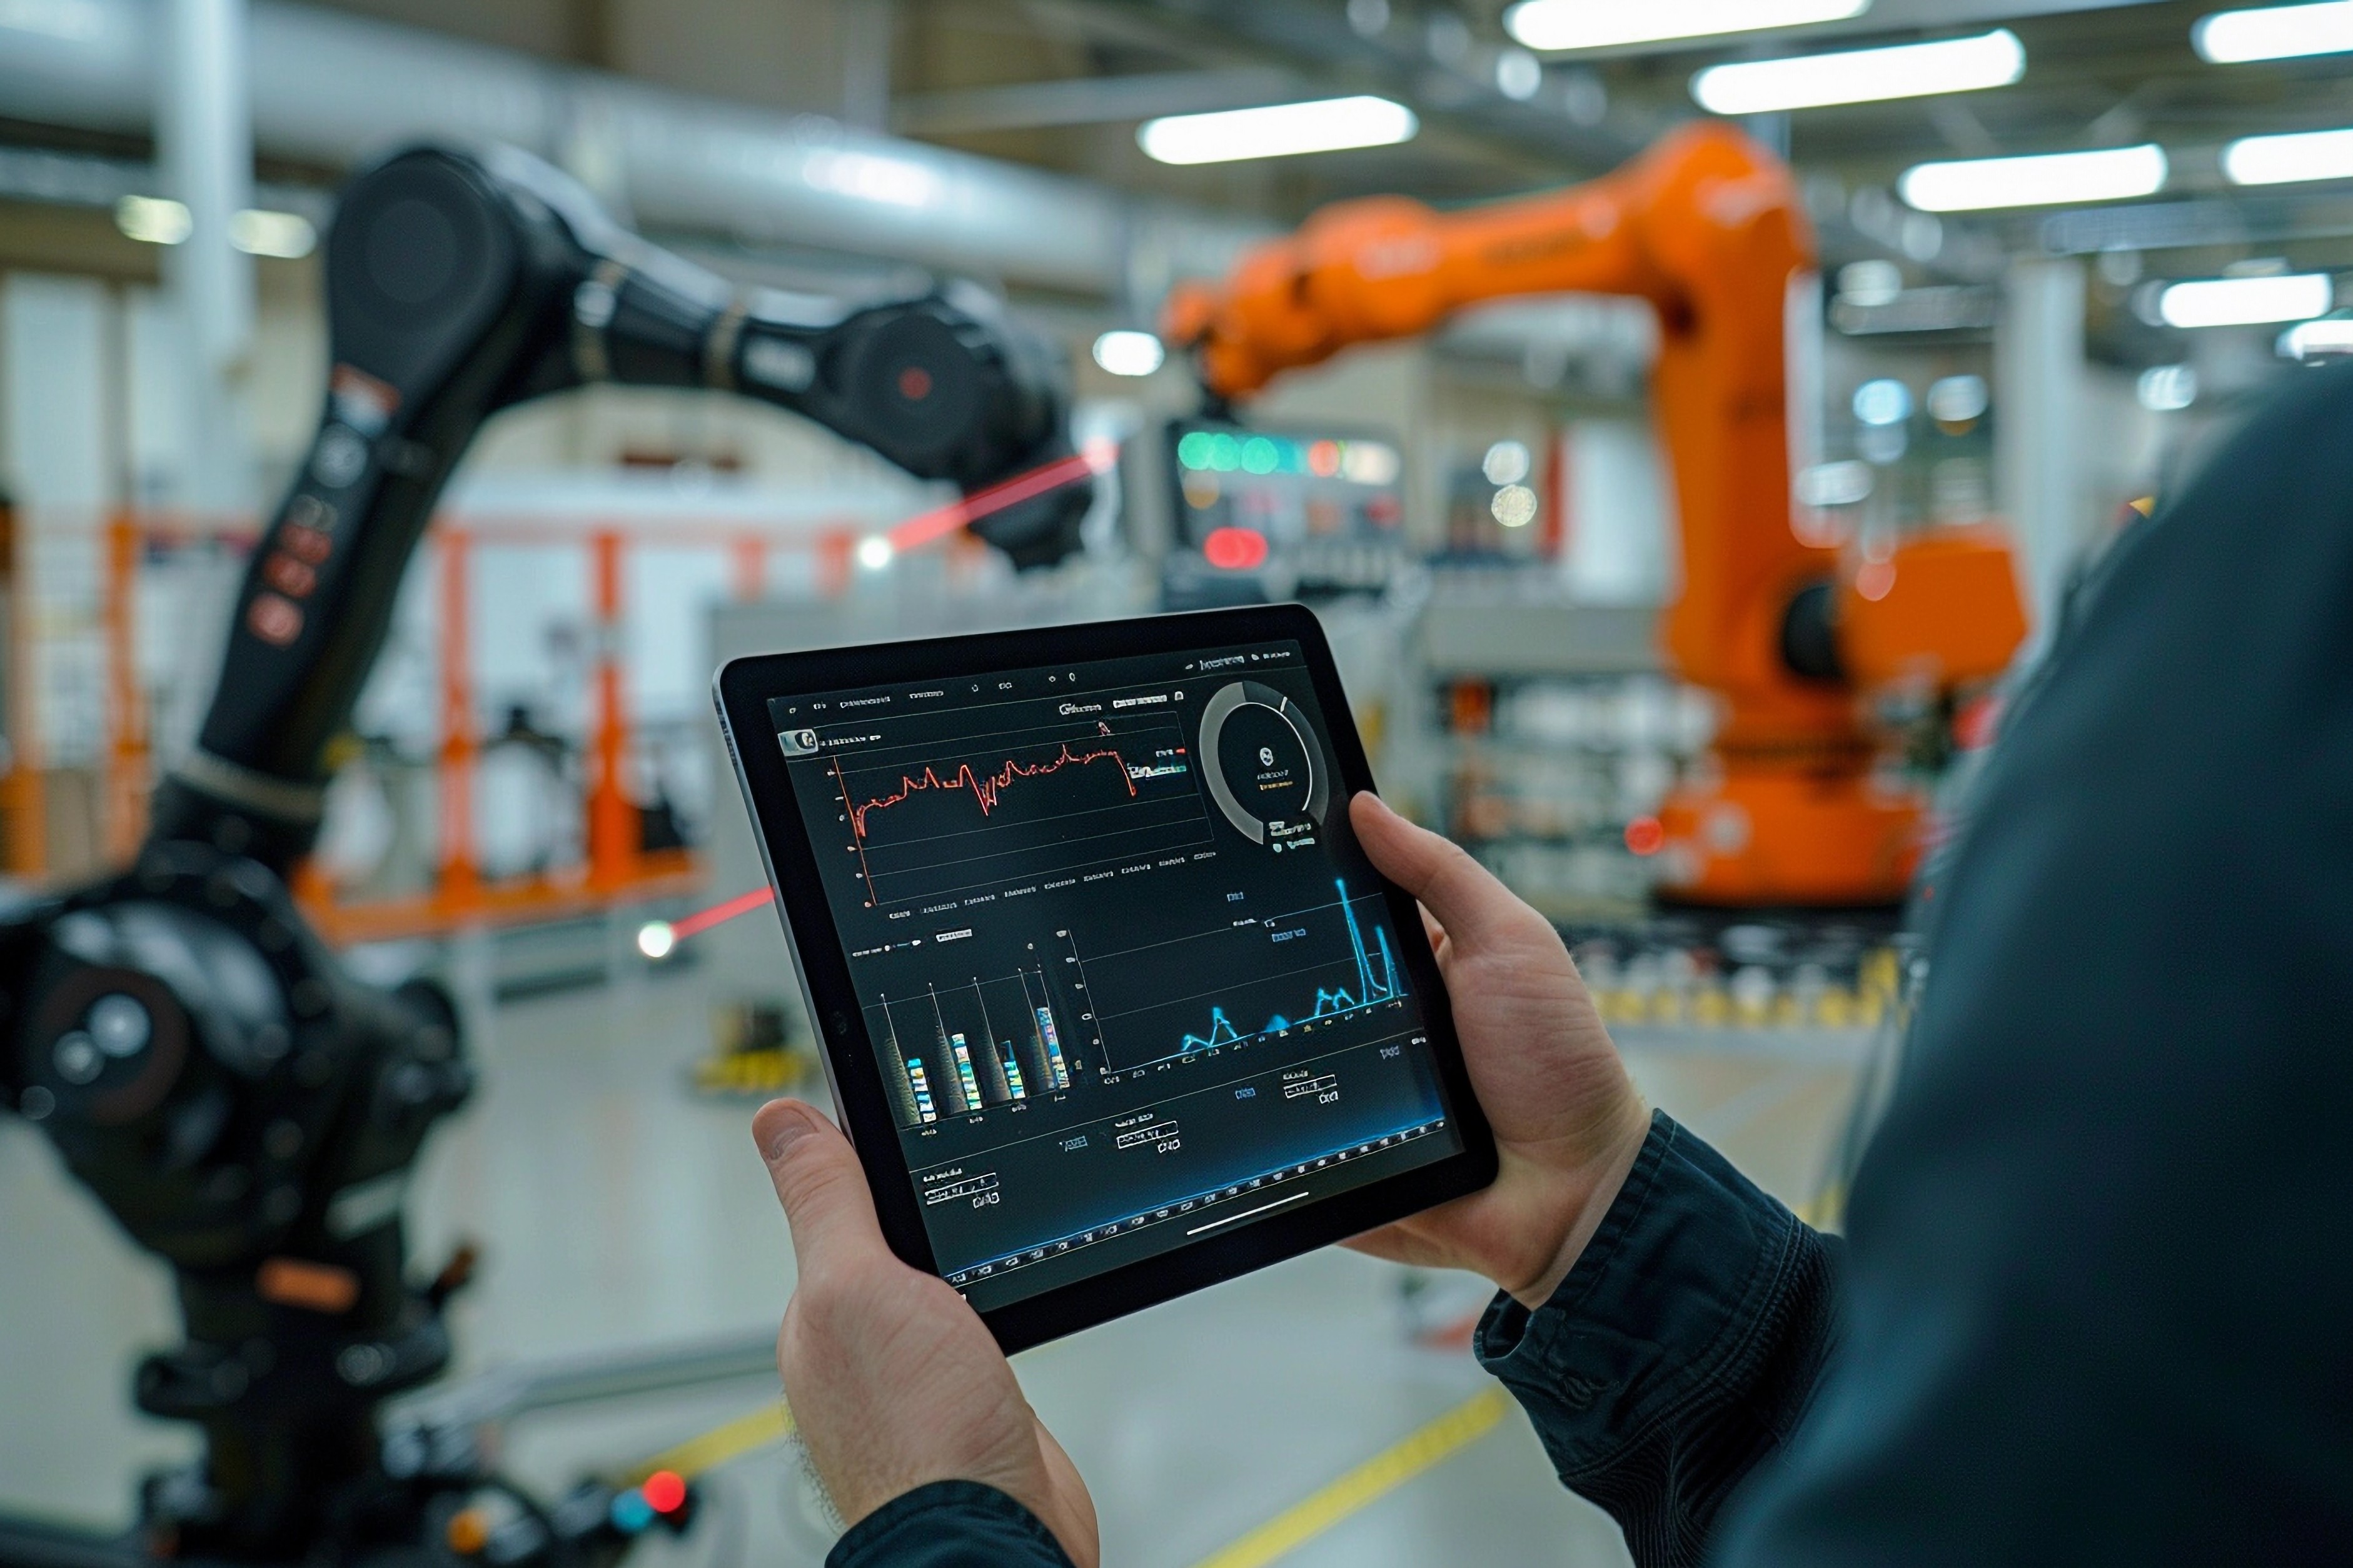
Open case studyReal-time Data Analysis For All Your Plant Telemetry
Ingest data from every edge device and protocol—MQTT, CoAP and more—and give plant managers a live, unified view of what’s happening on the floor.
Problem Statement
Klyff Analyzer closes this gap. It’s your unified telemetry layer: ingesting data from all devices, normalizing it, and presenting real-time, actionable dashboards for plant managers and supervisors.
Sensors, PLCs, gateways, vision systems, and edge devices all speak different protocols and send data to different places.
Operations teams struggle with multiple dashboards (SCADA here, vendor portal there, spreadsheets everywhere).
Plant managers don’t have a single, live source of truth for line status, quality, throughput, energy, or machine health.
IT is wary of yet another cloud system; OT needs something that works reliably on-prem and at the edge.
Klyff Analyzr Delivers
Built to give operations teams live visibility while giving engineering and IT flexible data ingestion, storage, and integration paths.
One dashboard for lines, cells, and utilities across your plant (and across plants if needed).
Second-by-second values for key tags—temperature, vibration, pressure, speed, OEE, FPY, alarms.
Drill down into hours, days, or months of history to understand trends and root causes.
Thresholds, anomalies, and rule-based alarms routed to the right people on the right channels (email, SMS, chat, Andon).
Protocol support for MQTT, CoAP, HTTP and industrial connectors via gateways (Modbus, OPC-UA, etc.).
Time-series database designed for high-frequency telemetry from thousands of devices.
Authenticated devices, encrypted transport, and strict tenant/role-based access.
Northbound APIs to feed analytics, MES/ERP, data lakes, or custom apps.
How Klyff Analyzr Works
Analyzr connects plant data, normalizes telemetry, powers live dashboards, and routes action through alerts and downstream systems.
Connect edge devices directly via MQTT, CoAP, HTTP or through existing IoT and industrial gateways.
Map device payloads (JSON, binary, custom formats) to normalized telemetry streams—tags, attributes, events.
Group devices into lines, cells, and assets to match your plant layout.
Ingest high-frequency telemetry into a fault-tolerant time-series store designed for industrial data.
Enrich data with metadata (line, product, shift, order, operator) for meaningful slicing.
Handle network interruptions gracefully with buffering and back-pressure—no data lost.
Build dashboards with configurable widgets: trend charts, gauges, KPIs, maps, tables, alarm views.
Show latest values (for example current speed, temperature, OEE) and live trends side-by-side.
Create separate views for plant managers, shift supervisors, maintenance, and quality—each seeing what matters most.
Configure rules: thresholds (high/low), rate-of-change, combinations of tags, or learned anomalies.
Trigger alerts, create maintenance tickets, or call into external systems via webhooks and APIs.
Use historical dashboards for “what happened?” and “why did it happen?” analysis after events.
Why Klyff Analyzr for connect and analyze
Klyff Analyzr brings plant-ready telemetry, flexible integrations, and edge-friendly deployment into one operational layer.
Built for lines, cells, OEE, FPY, alarms, and downtime—not generic IoT demos.
Analyzer is the “eyes and ears” for Klyff’s Quality, PdM, and Federated Learning engines, not a disconnected dashboard.
Designed to run close to your equipment, respecting data residency and latency constraints.
Supports modern IoT protocols (MQTT, CoAP, HTTP) and, via gateways, industrial protocols (Modbus, OPC-UA, etc.).
Use our widgets out-of-the-box or plug Analyzer data into your own reporting and BI tools.
Examples
Teams can use Analyzr to monitor production, maintenance, and utilities from one connected telemetry layer.
Where Analyzr Excels
Analyzr fits best where teams need one reliable view across fragmented plant data sources.
Mix of PLC brands, smart sensors, gateways, and edge boxes. Existing SCADA for control, but limited or fragmented analytics and visualization. Analyzer sits above these, aggregating and normalizing data into one consistent view.
Lines where hundreds or thousands of tags update every second. Teams need to see immediate impact of parameter changes on quality, throughput, or energy consumption. Analyzer provides live feedback during the shift—not weeks later.
Roll-up dashboards for regional or global operations teams. Compare plants on OEE, FPY, downtime, alarm rate, and energy per unit, while feeding Klyff’s Predictive Maintenance, Quality Inspection, and Federated Learning modules from one telemetry layer.
FAQs
Selected Customer Success Stories
Explore how teams are using Klyff to improve quality, safety, and operational performance in the field.
Case Study
Revolutionized asset monitoring in cold chain logistics and smart agriculture using Klyff's Edge AI-powered IoT platform for efficiency, sustainability, and real-time insights.
Open case study
Case Study
Discover how a global retail leader reduced energy costs by 15% using Klyff's Edge AI platform for real-time monitoring, anomaly detection, and proactive energy management.
Open case studyMore Case Studies
talk to an engineer today
Insights
Connect your first site, deploy your first model, and see measurable ROI in weeks, not months.